Executive Summary
This analysis examines foreclosure filing trends across Illinois' seven-county Chicagoland region from 2006 to 2025, revealing distinct patterns through market cycles. The 2008 housing crisis dramatically increased foreclosures, peaking in 2010 with over 83,000 filings. A long recovery period followed until 2019, when the pandemic created artificial lows in 2020-2021 due to moratoriums. Post-pandemic numbers have rebounded significantly but remain well below crisis levels. Early 2025 data suggests foreclosure activity may be accelerating, potentially signaling new housing market challenges.
Introduction
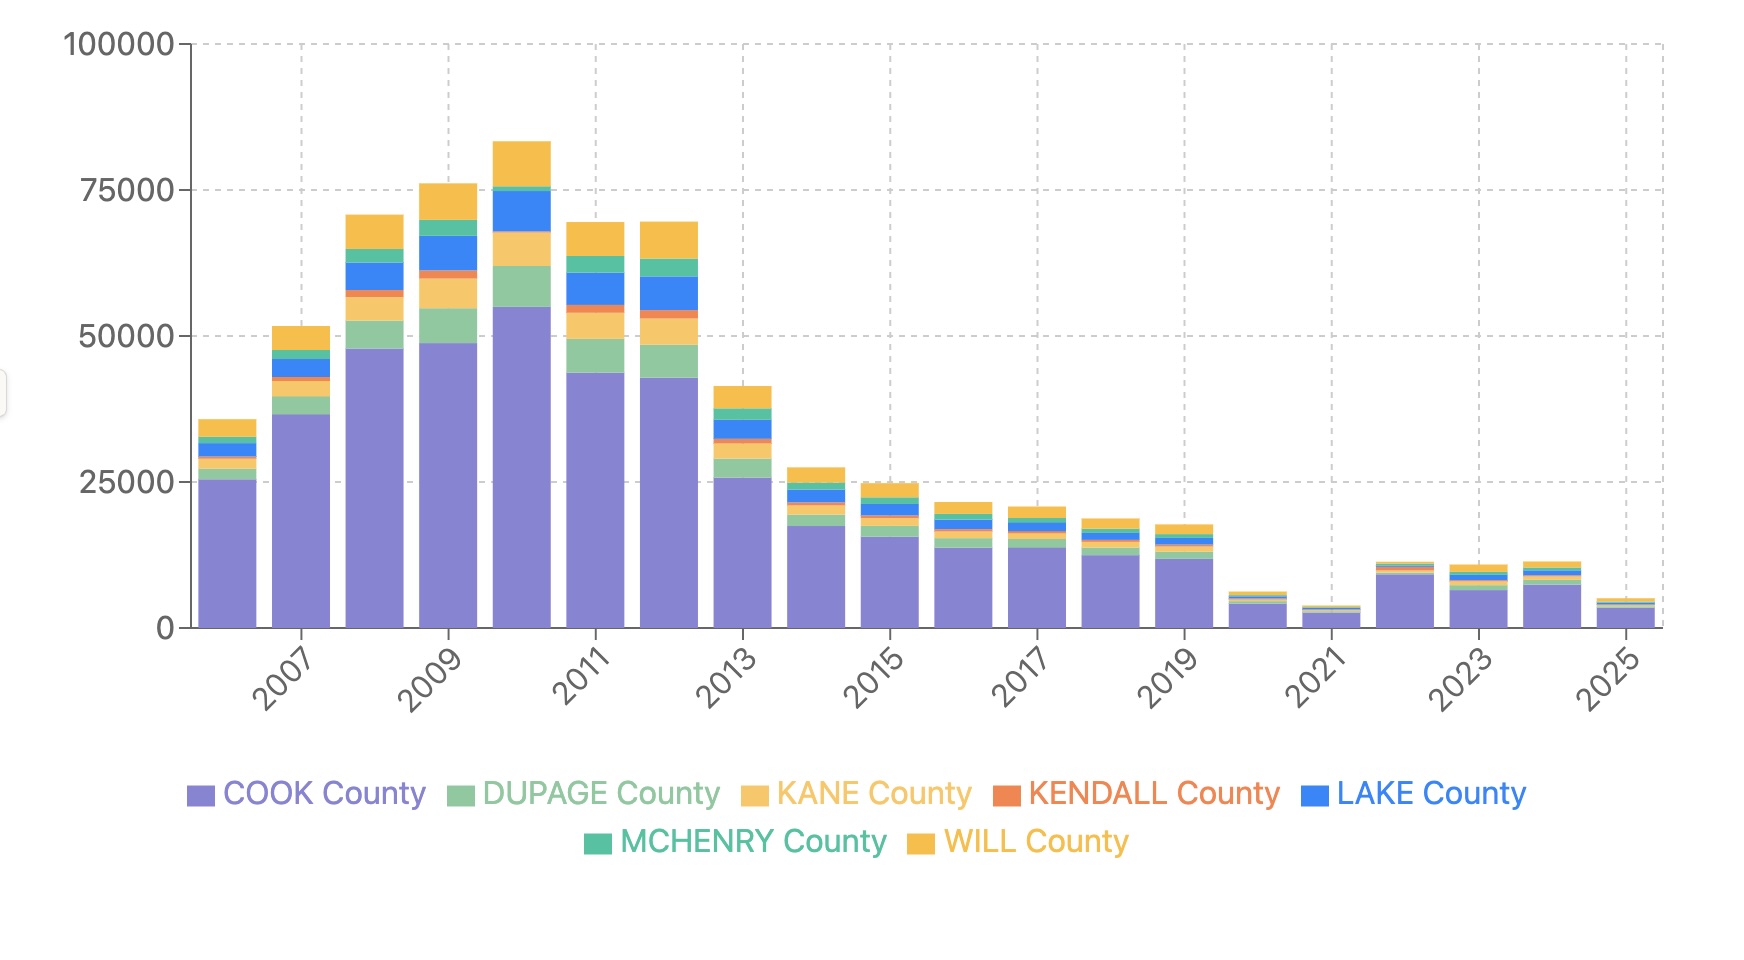
The foreclosure landscape in Chicagoland has experienced dramatic shifts over the past two decades, reflecting broader economic trends, policy interventions, and housing market dynamics. Using comprehensive data spanning from 2006 through early 2025, this analysis provides a detailed view of foreclosure patterns across Cook, DuPage, Kane, Kendall, Lake, McHenry, and Will counties.
By examining this extended timeline, we can identify clear patterns related to the 2008 housing crisis, the subsequent recovery, the unprecedented impact of COVID-19 pandemic policies, and the current post-pandemic landscape. This article presents a visual "heat map" of foreclosure trends and explores what these patterns reveal about the regional housing market's health.
Methodology
The data, provided by ILFLS.com (Illinois Foreclosure Listing Service), encompasses monthly new foreclosure filings from 2006 through April 2025 across all seven Chicagoland counties. For 2025, we present both the actual four-month totals and projected annual figures (calculated by multiplying the four-month data by 3) to provide a reasonable full-year estimate based on current trends.
The Great Housing Crisis (2006-2010)
Rising Tide of Distress
The data clearly illustrates the devastating impact of the housing crisis, with foreclosure filings rising dramatically between 2006 and 2010:
| Year | Total Foreclosures | Year-over-Year Change |
|---|---|---|
| 2006 | 35,756 | - |
| 2007 | 51,698 | +44.6% |
| 2008 | 70,785 | +36.9% |
| 2009 | 76,140 | +7.6% |
| 2010 | 83,347 | +9.5% |
The crisis peaked in 2010 with 83,347 foreclosure filings across the region—more than double the 2006 levels. Cook County was hit hardest in absolute numbers (54,983 filings in 2010), but suburban counties experienced the most dramatic percentage increases:
- DuPage County: +289% from 2006 to 2010 (1,799 to 7,004)
- Kane County: +234% from 2006 to 2010 (1,716 to 5,725)
- Lake County: +200% from 2006 to 2010 (2,302 to 6,902)
County Distribution During Peak Crisis
At the height of the crisis in 2010, the percentage distribution of foreclosures among counties was:
- Cook County: 66.0%
- Will County: 9.2%
- DuPage County: 8.4%
- Lake County: 8.3%
- Kane County: 6.9%
- McHenry County: 1.0%
- Kendall County: 0.2%
The Long Recovery (2011-2019)
Following the 2010 peak, a gradual but significant improvement occurred over nearly a decade:
| Year | Total Foreclosures | % Change from Peak |
|---|---|---|
| 2011 | 69,516 | -16.6% |
| 2012 | 69,591 | -16.5% |
| 2013 | 41,434 | -50.3% |
| 2014 | 27,508 | -67.0% |
| 2015 | 24,802 | -70.2% |
| 2016 | 21,575 | -74.1% |
| 2017 | 20,815 | -75.0% |
| 2018 | 18,757 | -77.5% |
| 2019 | 17,739 | -78.7% |
This recovery period shows several distinct phases:
- Initial Plateau (2011-2012): Foreclosures remained relatively high, declining only slightly from peak levels
- Rapid Improvement (2013-2014): A dramatic 50% reduction as the housing market recovered
- Gradual Normalization (2015-2019): Steady but slower improvements as foreclosure levels approached a healthier baseline
By 2019, foreclosure activity had dropped to just 21.3% of the 2010 peak, reflecting a substantially healthier housing market. However, levels remained higher than pre-crisis in some counties.
The Pandemic Anomaly (2020-2021)
The COVID-19 pandemic created an unprecedented disruption in foreclosure patterns due to government interventions:
| Year | Total Foreclosures | Year-over-Year Change |
|---|---|---|
| 2019 | 17,739 | - |
| 2020 | 6,245 | -64.8% |
| 2021 | 3,850 | -38.4% |
This 78.3% overall reduction from 2019 to 2021 was not a reflection of housing market strength but rather the implementation of foreclosure moratoriums and forbearance programs. These artificial constraints created historically low foreclosure levels across all counties:
- Cook County: -77.7% (11,834 to 2,636)
- DuPage County: -80.1% (1,216 to 242)
- Kane County: -83.3% (897 to 150)
- Lake County: -75.9% (1,140 to 275)
- Will County: -83.3% (1,662 to 278)
Post-Pandemic Rebound (2022-2025)
As pandemic protections expired, foreclosure activity began returning to more typical levels:
| Year | Total Foreclosures | Year-over-Year Change |
|---|---|---|
| 2021 | 3,850 | - |
| 2022 | 11,352 | +194.9% |
| 2023 | 10,872 | -4.2% |
| 2024 | 11,396 | +4.8% |
| 2025* | 15,045 | +32.0% |
*2025 figure represents a full-year projection based on January-April data (5,015 actual filings × 3)
The dramatic 194.9% increase in 2022 reflects the end of pandemic-related protections rather than a sudden housing market deterioration. However, the projected increase for 2025 is noteworthy, as it would represent the highest level since 2017 if the current pace continues.
County-Level Post-Pandemic Recovery
Recovery patterns varied significantly across counties from pandemic lows (2021) to current levels (2024):
- Cook County: +182% (2,636 to 7,428)
- DuPage County: +235% (242 to 810)
- Kane County: +293% (150 to 589)
- Lake County: +206% (275 to 842)
- Will County: +271% (278 to 1,031)
Current Status vs. Historical Benchmarks
To understand the current foreclosure landscape, we can compare 2024 figures to key historical benchmarks:
2024 vs. Pre-Crisis (2006)
| County | 2006 | 2024 | % Change |
|---|---|---|---|
| Cook | 25,467 | 7,428 | -70.8% |
| DuPage | 1,799 | 810 | -55.0% |
| Kane | 1,716 | 589 | -65.7% |
| Kendall | 376 | 210 | -44.1% |
| Lake | 2,302 | 842 | -63.4% |
| McHenry | 1,078 | 486 | -54.9% |
| Will | 3,018 | 1,031 | -65.8% |
| TOTAL | 35,756 | 11,396 | -68.1% |
2024 vs. Peak Crisis (2010)
| County | 2010 | 2024 | % Change |
|---|---|---|---|
| Cook | 54,983 | 7,428 | -86.5% |
| DuPage | 7,004 | 810 | -88.4% |
| Kane | 5,725 | 589 | -89.7% |
| Kendall | 210 | 210 | 0.0% |
| Lake | 6,902 | 842 | -87.8% |
| McHenry | 816 | 486 | -40.4% |
| Will | 7,707 | 1,031 | -86.6% |
| TOTAL | 83,347 | 11,396 | -86.3% |
2024 vs. Pre-Pandemic (2019)
| County | 2019 | 2024 | % Change |
|---|---|---|---|
| Cook | 11,834 | 7,428 | -37.2% |
| DuPage | 1,216 | 810 | -33.4% |
| Kane | 897 | 589 | -34.3% |
| Kendall | 337 | 210 | -37.7% |
| Lake | 1,140 | 842 | -26.1% |
| McHenry | 653 | 486 | -25.6% |
| Will | 1,662 | 1,031 | -38.0% |
| TOTAL | 17,739 | 11,396 | -35.8% |
2025 Projections and Emerging Trends
Based on the first four months of 2025, foreclosure activity appears to be accelerating. If current trends continue, the region would see approximately 15,045 foreclosures in 2025, a 32.0% increase from 2024.
This projected increase varies significantly by county:
| County | 2024 | 2025 (Proj.) | % Change |
|---|---|---|---|
| Cook | 7,428 | 10,416 | +40.2% |
| DuPage | 810 | 744 | -8.1% |
| Kane | 589 | 639 | +8.5% |
| Kendall | 210 | 249 | +18.6% |
| Lake | 842 | 969 | +15.1% |
| McHenry | 486 | 567 | +16.7% |
| Will | 1,031 | 1,710 | +65.9% |
| TOTAL | 11,396 | 15,045 | +32.0% |
Cook and Will counties show the most significant projected increases, potentially signaling emerging stress in these housing markets.
Key Insights and Implications
1. Current Context
Current foreclosure levels remain healthy compared to historical benchmarks. At 11,396 foreclosures in 2024, the region is at:
- 31.9% of pre-crisis (2006) levels
- 13.7% of peak crisis (2010) levels
- 64.2% of pre-pandemic (2019) levels
2. Concerning Indicators
The projected 32.0% increase for 2025 warrants attention, as it could signal emerging housing market stress. This appears to be concentrated in specific counties, particularly Cook and Will.
3. County Variations
County-level data reveals important variations in recovery patterns:
- Cook County consistently accounts for 65-70% of regional foreclosures
- Will County shows the most pronounced recent increase
- DuPage County foreclosures are projected to decrease in 2025, contrary to the regional trend
4. Market Recalibration vs. New Crisis
The current increases likely represent a market recalibration after pandemic-era interventions rather than the beginning of a new crisis. However, if the projected 2025 acceleration continues beyond this year, it could indicate more significant market issues.
Conclusion
The Chicagoland foreclosure landscape has traversed extreme cycles over the past two decades—from the devastating 2008 housing crisis through a long recovery, the artificial pandemic suppression, and the current post-pandemic adjustment. While current levels remain significantly healthier than historical crisis periods, the projected acceleration in 2025 bears monitoring.
These trends provide valuable insights for policymakers, housing advocates, real estate professionals, and market analysts. The county-level variations highlight the importance of localized approaches to addressing foreclosure challenges and housing stability.
As the region continues to navigate post-pandemic housing dynamics, ongoing analysis of these foreclosure patterns will remain essential for understanding the health and direction of the Chicagoland housing market.